See Wallarm's AI Control Platform In Action
Jaeger vs Zipkin Distributed Tracing Systems
Introduction to Distributed Tracing Systems
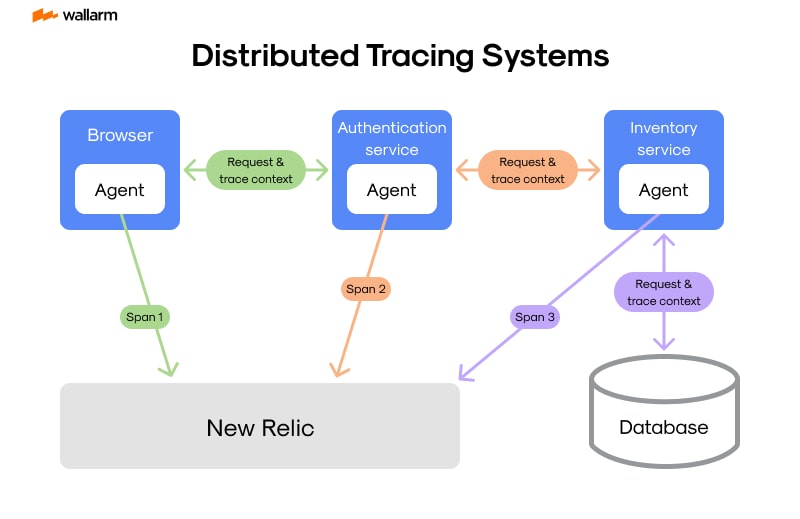
Distributed tracking - a sophisticated method for surveillance - plays a pivotal role in examining and maintaining software applications, primarily those built on micorservices designs. Its essential functionality is in identifying problems and decoding the underlying causes of unproductive performance.
Unraveling the Complexities of Distributed Tracing
Interpreting the diverse interactions inside a microservices framework to alleviate complications can be a formidable endeavor - think of trying to locate a small hay piece in an enormous barn - that's when the distributed tracing tool, skillfully designed, steps up providing a clear understanding of these dense networks, meticulously constructing a thorough and exact record of service connections.
Distributed tracking's power and intricacy are demonstrated in its adeptness to diligently follow the path of requests throughout myriads of microservices within a fixed structure. By applying meticulous tracing data, distributed tracing shapes a lucid image of how requests work within a microservices blueprint. This sweeping understanding is vital for comprehending the direction of requests, assisting in excavating hidden irregularities or system glitches.
The Necessity of Distributed Tracing
In scenarios with conventional integrated structures, recording is a mere task. But, as these structures evolve into more partitioned designs, the complexity escalates correspondingly. A single request can travel through multiple services, extending over several servers or data centers scattered worldwide. Deciphering this intricate request path can become a substantial trial, making it strenuously challenging to plot these processes in detail.
Amid such increased complexity, distributed tracing appears as a crucial instrument. It equips software architects and system administrators with the required tools to examine application trends and spot discrepancies rapidly. In today's fast-paced digital age, extended downtime can lead to hefty monetary losses and a potential tarnish to corporate reputation.
Value of Distributed Tracing in Modern Systems
Distributed tracing assumes a significant role in modern infrastructures, especially those shaped around microservices. Here are the primary benefits:
- Performance Augmentation: By capturing a complete record of request activities, this procedure aids in pinpointing system obstacles, thus enhancing the efficacy of the system.
- Failure Detection: This methodology helps in rapidly and simply identifying failures, reducing the time it takes to find solutions.
- Bolstering System Competencies: By providing a comprehensive glance at intricate systems, it establishes a foundation for successful problem detection and system improvements.
Moving forward, we'll delve deeper into two substantial players in the distributed tracing software industry - Jaeger and Zipkin. We'll evaluate their development, measure their competencies, and decode the terminology. This journey of exploration will provide valuable insights into these robust apps and how their features cater to specific requirements.
Emergence of Jaeger and Zipkin
Navigating the expansive landscape of large-scale network systems, the demand for proficient instruments to manage distributed systems has surged exponentially. This upward shift has spurred the formation of two trailblazing solutions, namely Jaeger and Zipkin, that significantly aid in distributed tracing.
Jaeger: Carved from Imperative Needs
Spearheaded by the Cloud Native Computing Foundation (CNCF), Jaeger's genesis took place within the tech powerhouse of Uber. The robust infrastructure of Uber, composed of over a thousand microservices, called for a sophisticated tracing mechanism to probe into errors and rectify service interactions.
The moniker 'Jaeger', derived from the German language, directly translates to 'tracker', symbolically asserting its primary function: revealing anomalies within expansive network systems. This solution is crafted to adhere to the OpenTracing standard, promising hassle-free integration across various systems.
Zipkin: The Origin Tale from a Bird's-Eye View
Yet another breakthrough in the arena of distributed tracing, Zipkin, is a brainchild of Google Dapper and nurtured by Twitter. Inspired by a bird species, 'Zipkin' signifies its fast tracing capabilities. Much like a bird swiftly cutting through the sky, Zipkin rapidly negotiates requests.
Designed to cope with the intricacies of service-oriented architectures (SOAs) and microservices, Zipkin elevates understanding of system operations by chronicling request executions.
Birth of Jaeger vs Zipkin
Although both Jaeger and Zipkin were established to untangle the multifaceted nature of distributed tracing, their developmental paths were remarkably different. Jaeger, concentrating on scalability and superior performance, was tailored to cater to comprehensive networks, making it an ideal choice for large corporations like Uber. Further supplemented by compatibility with diverse storage backends and a flexible architectural design, it becomes even more enticing.
In contrast, Zipkin embarked on a less conventional route, being crafted primarily with simplicity in mind. It provides a straightforward approach to distributed tracing, furnished with an interface designed keeping the user in mind, and a determination to simplify the tracing process.
Progression of Jaeger and Zipkin
As time passed, both Jaeger and Zipkin have exhibited vibrant progressions, refining their features and escalating their capabilities to meet user critique and the changing face of distributed systems.
Jaeger broadened its storage possibilities, inculcated varying sampling techniques, and introduced adaptive sampling, alongside performance-boosting features. The community of its developers thrived, stretching to global proportions.
Parallelly, Zipkin evolved by accelerating its execution speed, backing more languages, and refining its interface. It welcomed adaptability, seamlessly merging with different tracing systems and standards.
In summation, the birth of Jaeger and Zipkin stems from the mounting necessity of adept tracing instruments in the sphere of distributed systems. Both exude distinct strengths and have undergone continuous transformations, mirroring the ever-changing essence of distributed systems.
Jaeger vs Zipkin: A Comparative Overview
Delving into Distributed Tracing Instruments: An Examination of Jaeger
Uber Technologies pioneered Jaeger, a tool designed to tackle difficulties associated with microservice-oriented architectural frameworks. As a revered entity of the Cloud Native Computing Foundation (CNCF), Jaeger provides an all-inclusive solution suite for overseeing dispersed traces.
Jaeger simplifies intricate performance complications by rendering comprehensive time-ordered reports of multiple services, thereby illuminating prospective speed bottlenecks. Its compatibility extends to storage ecosystems like Google Cloud Spanner, Elasticsearch, and Apache Cassandra and to prominent open-source stages like Istio, gRPC, and Envoy.
Unraveling the Complexity of Zipkin
Zipkin has earned credibility for its role in tracking distributed frameworks. Its primary focus is recording timing specifics vital for handling latency dilemmas across assorted service setups. The user interface of Zipkin is intelligently built, easing data procurement and traceability.
Zipkin effortlessly merges with various storage ecosystems like Elasticsearch, In-Memory, Cassandra, and MySQL, serving diverse arrangements. It adheres to numerous protocols, including HTTP, Kafka, and gRPC, for data transfer.
Jaeger vs Zipkin: Conducting a Comparative Analysis
Jaeger and Zipkin, both esteemed in the domain of distributed tracing, exhibit notable differences:
- Trace Assembly Method: Jaeger opts for a 'pull' approach, selectively collecting traces destined for its agent, whereas Zipkin employs a 'push' technique to guide traces to its aggregation services.
- Framework Affiliations: Jaeger predominantly collaborates with OpenTracing incorporating a non-partisan collection of dispersed tracing tools and APIs. Conversely, Zipkin synergizes with both OpenTracing and OpenCensus, the latter encompassing robust library collections designed for smooth metrics gathering and dispersed tracing.
- Data Storing Options: Both Zipkin and Jaeger accommodate a range of storage platforms. However, Jaeger supports a more expansive selection including Apache Cassandra, Elasticsearch, and Google Cloud Spanner, compared to Zipkin's primary focus on MySQL, Cassandra, and Elasticsearch.
- Interface Usability and Presentation: Both prioritize simplicity and clarity in their interfaces for trace visualization, but Jaeger advances with supplementary features like dependency graphs, trace timeline viewer, latency histogram.
Summing it up:
In conclusion, selecting Jaeger or Zipkin hinges on the explicit goals and requirements of the project in context. Each platform serves as integral distributed tracing apparatus, offering unique merits.
Workflow of Jaeger and Zipkin
Working within the extensive universe of widespread tracking technologies, achieving proficiency in using platforms like Jaeger and Zipkin is vital. Knowledge about such platforms will augment your understanding of their functionalities and their contributions in amplifying system productivity.
Deep Dive into Jaeger's Operational Progression
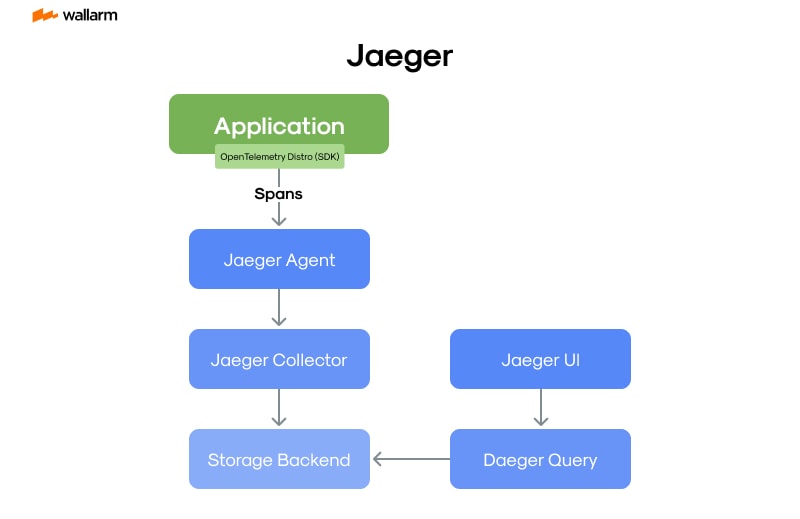
Allying with the Cloud Native Computing Foundation (CNCF), Jaeger employs a distinctive process infrastructure, engineered to provide top-tier extensive tracking solutions. Consider this a blueprint of Jaeger’s modus operandi:
- Integration Phase: This is where you intertwine the built-in libraries of Jaeger with your application code, paving a smoother path for the creation and transition of trace details towards a Jaeger constituent.
- The Mediating Module in Jaeger: In essence, this segment of Jaeger acts as the mediator, supervising spans via the User Datagram Protocol (UDP). These spans are arranged methodically and transferred to the compiling mechanism.
- Compilation Cluster in Jaeger: As an upcoming phase, this subunit assimilates, scrutinizes, and classifies spans derived from Jaeger's mediating module, documenting them in a backend model.
- Preservation Stage: Jaeger is known for its compatibility with various storage options like Elasticsearch, Apache Cassandra, and Google Cloud Storage. At this juncture, the spans are preserved for future utility.
- Extraction Phase: Jaeger's unique feature manually extracts the traces stored in the preservation configuration for demonstrative purposes on the user’s control panel.
- Jaeger's Visual Exhibit: For an orderly display and an in-depth analysis of recovered traces, Jaeger features a web-oriented control panel.
The Work-cycle of Zipkin
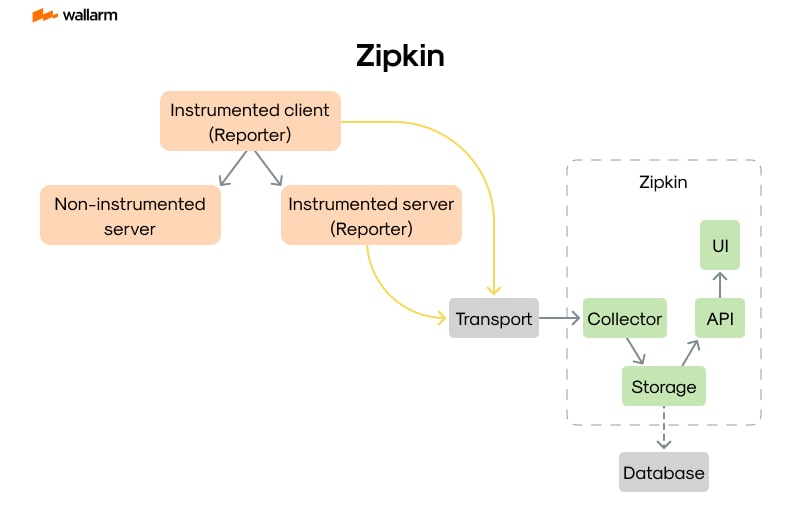
Alternately, Zipkin targets extensive tracing tasks revolved around the gathering of timing details, which are critical to determining latency issues in service schemes. Let’s glance through Zipkin’s operation carousel:
- Code Embedding: Reflecting Jaeger's modus operandi, this phase of Zipkin involves encapsulating Zipkin’s in-built libraries with the originating code, triggering the generation of traces and their dispersion to the Zipkin core.
- The Mainstream Component of Zipkin: Being the backbone of Zipkin, this segment accepts, examines, and organizes the spans into a backend setup.
- Conservation Phase: Zipkin promotes backend facilities like Elasticsearch, Apache Cassandra, and MySQL to house spans for possible recovery.
- Zipkin's Visual Portrayal: The web interface of Zipkin allows for orderly presentation and thorough analysis of these traces.
Below is a detailed comparison of how Jaeger and Zipkin operate:
Upon examining, it is clear that Jaeger's methodology involves an added mediator and a trace recovery mechanism, bestowing more flexibility and authority. However, Zipkin's approach is rather direct, which might serve better depending upon the specifics of the situation.
Features of Jaeger: The Powerhouse of Tracing
Astute Tool from Uber: Jaeger, Pioneering in Advanced Cyber Surveillance
Uber Technologies crafted Jaeger, a unique and standalone remote monitoring tool. This invention aids developers in deciphering and troubleshooting intricacies tied to individual cloud-based services. Jaeger's impressive set of features provides top-tier tracing functionalities. Let's divert our attention to the ins and outs of this exceptional, accessible application.
Extraordinary Elasticity and Effectiveness
Jaeger's engineered framework operates efficiently under colossal data flow by maintaining fast processing speed. It flaunts an ability to gather and preserve vast digital footprints, ensuring its workflow remains smooth. Jaeger excels in handling a microservices setting, where multiple services function simultaneously.
Unique Ability in Enhancing Performance
Jaeger owns an uncommon talent to create an inherent understanding of system progression. It does so by revealing factors like latency, linkages, and the tangled network of service interplay. These details are indispensable in fine-tuning the performance and pinpointing system logjams.
Comprehensive Context Relaying Traits
With an expansive range of context transfer capabilities, Jaeger guides the movement of requests through a broad array of services. It continues uninterrupted regardless of the operational segmentation of these services, even under decentralized hosting or handling of several datacenters. This feature assists in plotting the course of requests within the system and predicting possible snags.
Tailored Sampling Techniques
Jaeger utilizes modifiable sampling strategies, giving users the freedom to control the rate of trace sample storage and management. This versatility is key during heavy-traffic conditions where storing footprints for each activity becomes unwieldy and extravagant.
Harmonization with Allied Systems
Jaeger works seamlessly with other monitoring and tracing tools such as Prometheus and Grafana. It eases the task of associating trace data with different metrics and logs, forming a concrete image of system progression.
Assortment of Storage Alternatives
Jaeger provides several storage choices, encompassing Elasticsearch, Cassandra, and Google Cloud Storage. It provides users with the flexibility to choose a storage solution that harmonizes best with their financial limitations and necessities.
User-Centric Interface
Jaeger comes loaded with an instinctive user interface designed for effortless trace data exploration and navigation. The interface houses a variety of filters and search features, expediting the data retrieval process.
Accordance with OpenTracing
A remarkable trait of Jaeger is its compliance with OpenTracing standards. This ensures smooth migration from other tracing platforms adhering to similar regulations.
In a nutshell, Jaeger is a standout tool in the tracking universe. Notable factors contributing to this stature are its powerful scalability, detailed performance analysis, comprehensive context relaying attributes, pliable sampling, harmonious integration capabilities, wide range of storage backend alternatives, user-oriented interface, and OpenTracing compliance. Accordingly, Jaeger is considered an optimal solution in the realm of microservices architecture surveillance.
Features of Zipkin: Simplifying the Complexities
Zipkin, a gift from the domain of open-source software, excels at network tracing tasks, adeptly amassing vital timing stats from diverse sectors of your software ecosystem. Its aptitude for crafting and scrutinizing this pivotal data equips you with a thorough comprehension of your system's operations and decodes the intricate workings in distributed environments. This proficiency elevates Zipkin as a prime choice among developers and system architects.
Simplified Network Scrutiny
The principal function of Zipkin revolves around facilitating distributed network examination. It excels at extracting data from an array of services nestled within the said network, compiles this data, and represents it in a manner that is easy to interpret. This helps in pinpointing system bottlenecks and tactical drawbacks within intricate network setups.
Clear Data Representation
A standout attribute of Zipkin lies in its superior data presentation abilities. Its web-based dashboard represents tracing data in an approachable, easy-to-digest manner. It incorporates dependency maps, timeline visuals, and a unique trace viewpoint, streamlining the detection and rectification of operational glitches.
Versatile Back-End Storage
Beyond its remarkable visualization, Zipkin showcases compatibility with a multitude of storage back-ends. Examples include in-memory storage, Cassandra, Elasticsearch, and MySQL, empowering users with the flexibility to decide on a storage solution aligned with their business structure and needs.
Solid Scalability
Designed to confront vast loads of trace data, Zipkin demonstrates the potential to scale horizontally as data volumes surge, making it an ideal candidate to tackle convoluted and extensive network scenarios.
Smooth Integration
Incorporating Zipkin into your system is hassle-free. A variety of complementary libraries, spanning Java, Go, Python, and more eases the integration of Zipkin's tracing feature to pre-existing modules.
Swift and Efficient
Constructed with a focus on efficiency, Zipkin strives to maintain minimal impact on applications. It employs a sampling strategy to curtail the quantity of data procured and stored, safeguarding your applications against unwarranted pressure from tracing exercises.
Collaborative Open Source Initiative
Being an open-source platform, Zipkin leverages the collective knowledge of developers worldwide, who relentlessly strive towards its enhancement and expansion. By doing so, Zipkin remains current and sensitive to user requirements.
In conclusion, Zipkin is designed to dissect the complexities of distributed tracing. With its sophisticated data visualization, adaptable storage choices, substantial scalability, hassle-free integration potential, and frugal architecture, it stands out as an appealing choice for network tracing. Yet, as is the case with all tools, it possesses its unique set of merits and demerits, which will be elaborated upon in subsequent sections.
Decoding the Technical Specifications: Jaeger
Uber Technologies gave the world Jaeger, an incredibly efficient system for distributed tracing, that can deftly map out intricate service interactions found within sophisticated microservices networks. Its primary mission is to equip developers with the tools they need to supervise and solve issues within these strikingly complex distributed systems, which can oftentimes appear elusive due to their disperse layout.
Inside the Jaeger Family
Diving within the architecture of Jaeger, we find a family of central constituents each bearing its own technical traits.
- Jaeger Client: We have the client, a language-specific toolkit seamlessly integrated within the services to be under surveillance. Its duty is to catch timing knowledge, mould spans and dispatch them towards the Jaeger Agent.
- Jaeger Agent: The agent plays the role of a network elf, receptive to spans forwarded via User Datagram Protocol (UDP), gathering them before forwarding them to the collector. Ideally, this elf is deployed as a ubiquitous fixture across all hosts.
- Jaeger Collector: The collector takes in traces from the Jaeger Agent and runs them through a processing gauntlet. Here, traces are scrutinized, indexed, and then sequestered.
- Jaeger Query: The Query acts as a retriever of traces from the storage area and hosts a user interface for their display.
- Jaeger Storage: Lastly, storage is a vault where the trace data is stored. Supported by an array of storage methodologies, Jaeger is compatible with Elasticsearch, Apache Cassandra, and Google Cloud Storage.
Regulation and Efficiency with Jaeger
The technical guiding principles of Jaeger have been set to ensure top-tier performance, expansive scalability, and user-friendly interaction. A peek into the pivotal technical principles:
- Multilingual Understanding: Jaeger extends its client libraries across numerous programming languages including Java, Go, Python, Node.js, C++, and C#.
- Protocols of Conversation: Jaeger leans on the strengths of HTTP/HTTPS and UDP to facilitate communication between components. The Jaeger Client dialogues with the Jaeger Agent via UDP, while the Jaeger Agent liaisons with the Jaeger Collector over HTTP/HTTPS.
- Schematic Structure: Jaeger employs a nifty and efficient data schema that is built around spans and traces. Here, a trace is an assemblage of spans that embody one transaction or workflow. A span is essentially a solitary task executed within a trace—this could be a function invocation or a database query.
- Storage Options: Jaeger aligns with a varied list of storage platforms including Elasticsearch, Apache Cassandra, and Google Cloud Storage. This adaptability lets you hand-pick the storage system that resonates with your requirements.
- Sample-Control: Jaeger boasts an array of sampling approaches to keep check on the volume of tracing data to be captured and housed. The methods include constant sampling, probabilistic sampling, and rate limiting sampling.
- Peak Performance: Jaeger's design is performance-optimized and able to handle a tsunami of spans per second with negligible overhead.
- Scalability Squad: The architecture of Jaeger arms it with the potential to scale horizontally, empowering it to manage excessive volumes of tracing data.
- At Ease with Integration: Jaeger meshes well with other observability instruments like Prometheus and Grafana for assortment and visual portrayal of metrics.
In juxtaposition, here's an illustrative chart that encapsulates the critical technical guidelines of Jaeger:
In a nutshell, the technological benchmarks of Jaeger vest it with immense power in distributed tracing. By extending support for a medley of programming languages, offering flexible storage choices, and capability to integrate smoothly with other observability utilities like Prometheus and Grafana, Jaeger becomes an extremely adaptable solution for supervising and disentangling the complex web of distributed systems.
Decoding the Technical Specifications: Zipkin
Unraveling the knotty world of microservices, Zipkin emerges as an indispensable tool, shedding light on the inner workings of such complex systems. It provides a clear lens to view the duration of service requests, thereby helping identify potential slow spots that could benefit from optimization. The core merits of Zipkin are discussed in this article.
Blueprint and Design
Zipkin's design can be likened to a fortress built on four foundational blocks: the collector, the warehousing unit, extraction utility, and the visualization platform. Acting as a vigilant watchtower, the collector receives and validates spans transmitted from encapsulated services. These spans find their safekeeping place in a backend storage of choice, be it Elasticsearch, Cassandra, or MySQL. Employing the extraction utility, users can access specific spans stored in the backend through set parameters. To finish off, the graphical dashboard aggregates these results, weaving together a cohesive storyline of the trace data.
Data Components
Spans and traces form the building blocks of Zipkin's data structure. In simplest terms, a span reflects an isolated operation like a service query or a database check, enriching it with supplemental details via annotations and tags. Concurrently, a trace emerges as a collage of spans, recounting a single occurrence such as a client request. In the trace mosaic, each span connects back to its antecedent, creating a directional arrow that indicates the progression of the occurrence.
Synchronization with Tools
Zipkin forms alliances with various tool libraries spanning a variety of coding languages such as Java, Go, Python, and Node.js. These libraries autonomously generate and direct spans to Zipkin, thereby streamlining service set-up. Zipkin further enhances its integration capabilities by vibrating on the same frequency as OpenTracing and OpenTelemetry frameworks, allowing for a seamless switch between different tracing architectures without the need for code modifications.
Adjustable Storage Systems
Exhibiting its expansive applicability, Zipkin comfortably meshes with a range of backend solutions like Elasticsearch, Cassandra, or MySQL. This customizability allows you to choose the storage system that best suits your specifications. If you prefer a versatile and easily reachable storage system, Elasticsearch might be your ideal pick. On the flip side, MySQL might be perfect if simplicity and cost-effectiveness rank high on your list.
Trace Examination and Depiction
Equipped with a potent trace exploration interface, Zipkin enables trace queries based on criteria such as the service tag, operation display, and annotation inputs. The results of this investigation are spotlighted in a chronological depiction, displaying the span duration and sequence in each trace. This narrative representation amplifies understanding of transaction dynamics and potential bottleneck zones.
Operational Impact
Zipkin is built to handle a hefty influx of spans, all while ensuring minimal disruption to service implementation. Owing to its feature of asynchronous span submission, Zipkin doesn't obstruct operative workflow. Boosting its efficiency further, Zipkin possesses a throttling function that limits the volume of data collection and storage, thus sparing your storage from unnecessary strain.
Interoperability Across Diverse Systems
Exhibiting unparalleled integration flexibility, Zipkin can sync with multiple tracing architectures like Jaeger and Lightstep, courtesy of its adherence to OpenTracing and OpenTelemetry norms. This flexible feature provides a gateway for Zipkin's deployment in heterogeneous environments, embracing an assortment of services operating on varied tracing frameworks.
In summation, Zipkin combines technical prowess and multifunctionality to provide a formidable answer for distributed tracing. Its recipe of a fractioned structure, flexible storage options, authoritative trace scrutiny and visualisation controls, along with compatibility with a vast array of tool libraries, carves out its position as a versatile answer to decipher and fine-tune complex microservice environments.
Unveiling the Architectural Design: Jaeger
The Jaeger framework is potent, easily expandable, and highly adaptable, making it an ideal solution for managing distributed traces. Its use of microservice-based architecture bolsters its ability to swiftly adjust and expertly oversee complex distributed networks.
Jaeger's Design Framework: Core Components
Jaeger's structure primarily comprises various crucial components, each amplifying the tracing process' effectiveness. Crucial roles include:
- Instrumentation Libraries: The task is dual purposed - to generate and accumulate traces from software applications. It further guarantees seamless transmission of these traces from one service to the subsequent ones and onto the Jaeger Protectors.
- Jaeger Protector: This operates as a network watchman, gathering spans transmitted via the User Datagram Protocol (UDP), packaging them, and directing them to the Jaeger Assembler. It can be configured as a sidecar, as a system-wide safety net, or merged within an application as a core library.
- Jaeger Assembler: Consider this the hub where the traces collected by the Jaeger Protector come together and are thrust into a processing stream. The traces undergo an error-checking and indexing procedure for improved findability before being stored.
- Data Storage Units: Jaeger's compatibility with diverse storage units like Elasticsearch, Apache Cassandra, and Google Cloud Storage boosts its utility. The choice of the most suitable storage unit depends upon particular case characteristics and needs.
- Data Retrieval Service and User Interface (UI): This component pulls out traces from the selected data storage unit using the Data Retrieval Service. The extracted traces are then delivered to the UI for hassle-free data representation.
Flow of Data within Jaeger's Design Framework
Understanding the movement of data within Jaeger's system is a fundamental aspect of comprehending its operational efficiency. A simplified version of Jaeger's data path includes:
- The process kicks off with the Instrumentation Libraries creating and assembling traces from various software applications.
- The traces are then directed to the Jaeger Protector for accumulation and subsequent delivery to the Jaeger Assembler.
- At the Assembler’s site, these traces are undergo refinement, put through error-checking, indexed for simplified searching, and finally, stored in the chosen storage unit.
- A user's request to view these traces triggers the Data Retrieval Service to pull them from the data storage unit for presentation on the UI.
Scalability and Flexibility
The impressive scalability of Jaeger lies in each component's individual scalability, allowing it to deftly manage massive data quantities. Its use of a microservices architecture provides Jaeger an inherent ability to restructure itself to meet varying requirements and needs.
Jaeger's system also exhibits high flexibility to fit certain application scenarios. Aspects such as storage unit selection can be customized according to application requirements. Likewise, unique processing stages, like data enrichment or modification, can be inserted into the Assembler's processing phase.
Integration with Other Systems
Jaeger flawlessly integrates into different systems, thanks to its compatibility with instrumentation libraries across a wide range of programming languages. Its design facilitates easy amalgamation into existing software applications. Moreover, Jaeger's versatility also includes acceptance of traces in various formats, like Zipkin, enhancing its ease of interoperability with other tracing platforms.
In conclusion, Jaeger displays impressive potency, scalability, and adaptability through its system design. Specially built for distributed tracing, it skilfully manages the complexities associated with modern decentralized networks.
Unveiling the Architectural Design: Zipkin
Zipkin, designed as an effective system for tracing distributed systems, functions with a straightforward, yet sturdy infrastructure that efficiently carries out aggregation, organization, and evaluation of trace information. Four critical elements build up Zipkin's structure: data aggregation module, data repository, data hunting module, and the user-interface over the web.
The Aggregation Module
Acting as the first point of interaction for incoming trace information in Zipkin, the data aggregation module takes on the roles of accepting and validating these traces before proceeding to storage. Trace details arrive via HTTP POST requests or data streams from Kafka, brought by applications that have instituted Zipkin libraries or similar compatible ones.
Designed for mass handling of trace information, the aggregator functions with a mix of memory buffering in real-time and asynchronous manipulation to cope with the incoming surge of data. To guarantee that the incoming trace data is accurate, complete, and aptly organized, an important validation stage is also included in the aggregator.
The Information Repository
Upon successful collection and validation, trace data finds its final resting place in Zipkin’s Information Repository. The repository is engineered for scalability and adaptability, compatible with a cocktail of backend storehouses. It not only encourages memory storage that benefits testing and development but also embraces powerful alternatives like MySQL, Elasticsearch, and Cassandra built for production application.
An essential feature of the repository is its indexing of trace data to simplify and accelerate searches. Trace ID, span ID, and supplementary trace characteristics serve as the criteria for this indexing task.
The Data Hunting Module
Operating intently on fetching and sieving the trace data, the data hunting module is activated by users' requests. This module leverages the indexed data from the repository, ensuring a swift and economical connection to any requested trace data.
The data hunting module flexibly accommodates multiple query specifications including service name, trace ID, span ID, and the related time frame. This feature empowers users to pinpoint and examine the relevant trace data swiftly.
The User-Interface Over The Web
The last pillar of Zipkin’s infrastructure is the web-based user-interface, designed as a route for users to explore and dissect trace data. It includes practical tools like trace detail view, dependency graph view, and a trace timeline view.
The user-interface features search and filter capabilities that are fuelled by the data hunting module, making navigation of large amounts of trace data a breeze for users.
Finally, Zipkin’s infrastructure, with its simplicity, efficacy, and capability to scale, manifests an organized system for collecting, storing, and interpreting trace data. This valuable tool presents insightful inputs into the functioning and mannerisms of distributed systems.
The Pros and Cons: Jaeger
In analyzing platforms that distribute tracing data, Jaeger conspicuously stands out as an influential tool. It parades an array of features that equally allure software engineers and corporations. Regardless, there lie both merits and demerits in its usage. In this analysis, we will decode the facets of Jaeger, offering a comprehensive critique of its admirable and less appealing features.
Distinguishing Features of Jaeger
Unparalleled Expandability
Jaeger distinguishes itself through unmatched expandability. Specifically tailored for managing arduous tasks and copious data aggregates, Jaeger solidifies its position as a forceful instrument for vast network resources and systems. This extraordinary expandability stems from its proficient handling of data and efficient distribution, combined with the capability to disseminate tracing information across multiple nodes.
Firmly Rooted in Open Source Guidelines and Standards
The core constitution of Jaeger deeply incorporates the principles of open source. Several users, therefore, access, modify and distribute it across their networks. This broad usage cultivates community solidarity among software engineers, sparking their contribution towards the continuous enrichment and advancement of Jaeger. Significantly, Jaeger complies with open principles, more so the Open Tracing principle, thereby ensuring harmonization with other tracing tools and systems.
Robust Visual Interpretation
At its core, Jaeger simplifies data comprehension by providing a detailed visual interpretation of tracing data. This enhances comprehension and judgement of performance in platforms distributing tracing data. Its intuitive interface exhibits tracing data in a user-friendly style, accelerating the process of identifying and rectifying problems for developers.
Seamless Synchronization with Other Frameworks
Uniquely, Jaeger integrates harmoniously with other frameworks such as Kubernetes and Prometheus. This unifying ability enhances its usefulness, granting software developers to take advantage of the functionalities of auxiliary platforms in tandem with Jaeger.
Aspects limiting Jaeger
Overbearing Complexity
Jaeger's diverse features underscore its strengths and simultaneously can also reveal its weaknesses. To newbies, deciphering the intricate nature of Jaeger could be intimidating. For effective admiration of Jaeger, developers need to acquire a specific skill set, posing a potential hindrance for some users.
Strained Resource Demand
Despite its strong scalability, Jaeger's operational demands could strain resources, especially when manipulating large scale data quantities. This could inflate costs significantly relating to storage and computational assets.
Insufficient Compatibility with Non-java Languages
Jaeger's unparalleled compatibility with the Java language does not extend to other programming languages, posing certain limitations. Subsequently, unhindered application in environments where other languages are prevalent may be inhibited.
In conclusion, Jaeger's strength circumvents its role as an expandable solution for sharing tracing data. However, the bold complexity paired with a demanding resource allocation may potentially form obstructions for certain users. Hence, it's prudent for corporations to cautiously assess these factors when considering whether Jaeger aligns with their unique requirements.
The Pros and Cons: Zipkin
Zipkin, an established tracing framework for disbursed systems, has won the hearts of numerous entities thanks to its streamlined functionality and performance. This section is devoted to a detailed examination of Zipkin's beneficial attributes and areas of concern.
What Sets Zipkin Apart?
The Art of Effortlessness
The heart of Zipkin's appeal lies in its trouble-free operation. It boasts an instinctive user interface enabling swift request tracing and bottleneck detection. Setting up and configuring Zipkin is also a breeze.
Capable of Massive Data Handling
Tailored for enterprise-level applications, Zipkin shows no signs of distress even when tracing millions of daily requests. Hence, it is a potent tool for handling colossal amounts of data without sacrificing system performance.
Adept at Unifying Technologies
Zipkin's adaptability is also noteworthy. It aligns with various coding languages and frameworks, including Java, Go, Python, to name a few. Beyond that, its alliance with different monitoring solutions enriches its functionality.
Community-Driven
Being an open-source solution means Zipkin garners valuable contributions from a thriving community of developers. Regular enhancements and bug resolutions keep the system up-to-date.
Zipkin's Shortcomings
Fewer Customization Choices
Zipkin's approach to keep things simple also leads to curtailed customization choices. In contrast, tools like Jaeger offer a greater breadth of personalization. This can pose a challenge for users who demand higher tailoring capabilities for their tracing systems.
Absence of Sophisticated Features
Notably, Zipkin lags in offering leading-edge elements available in alternative tracing systems. Features like adaptive sampling or dynamic span filtering unfortunately do not find a place in Zipkin's suite, making it less appealing for extensive applications.
Dependence on External Databases
Zipkin's reliance on external storages for preserving trace data raises concerns. It not only complicates the system but also presents an added risk element.
Insufficient Compatibility with Non-HTTP Protocols
While Zipkin shines in accommodating a mix of programming languages, it falls short in non-HTTP protocol support, creating a potential handicap for applications dependent on these protocols.
In sum, Zipkin comes across as a sturdy, proficient disbursed tracing framework with an uncluttered design and deep language compatibility. However, its comparison to other similar systems highlights a lack of customization and advanced capabilities. Users must consider these aspects for a well-rounded decision on a tracing system selection.
Use Case Scenario Analysis: Jaeger
Jaeger, a distinguished leader in the realm of distributed tracing systems, earns its praise thanks to a mix of reliable tools and superior efficiency. This section will reveal practical applications of Jaeger across diverse scenarios.
Scenario 1: Navigating Microservices Architecture
Weaved within a microservices system, different services collaborate to perform a unified function. Tracking the back-and-forth communication of these services can present a challenge. Jaeger masters this by employing its distributed tracing abilities to proficiently trace interactions and present an illustrative overview of the complete process.
Take, for instance, an e-commerce platform having separate services for user authentication, product database, shopping cart, and payment methods. As a customer buys an item, the request journeys through these services. Jaeger supports developers by tracing this course, identifying bottlenecks, and enabling system optimization for improved performance.
Scenario 2: Boosting Performance
Jaeger’s extensive tracing data can act as a driving force for system optimization. Developers can dissect traces to pinpoint the slowest parts of their system and target their efforts on those areas.
Consider a case where a webpage takes longer than usual to load a particular page. Developers can employ Jaeger to monitor the request from the user to the server across all the services involved in rendering the page. This trail of information can reveal whether the delay results from a slow database query, an underperforming service, or network lag.
Scenario 3: Identifying and Resolving Errors
Jaeger proves highly useful in detecting and fixing errors. It offers a detailed view of how requests travel across the system, enabling developers to accurately spot where a problem resides.
Let's say a user stumbles upon a bug within an application. Jaeger empowers developers to trace the user's steps leading to the error. This invaluable insight speeds up error detection and streamlines the issue resolution process.
Scenario 4: Latency Analysis
The powerful latency analysis tools of Jaeger can lead developers in identifying and fixing efficiency issues. By graphically showcasing latency variations across the system, it directs developers in finding delayed functions or operations.
As an example, if an API call takes longer than expected, developers can harness Jaeger to track the call and spot the stumbling block. This analysis can determine whether the issue originates within the API, a dependent service, or the network itself.
To wrap up, the utility of Jaeger extends beyond basic tracing. It's ability to provide profound system efficiency analysis, identify weaknesses, and support error detection commend it as an invaluable tool for developers dealing with distributed systems. From a complex microservices infrastructure to a simple web application, Jaeger can bring about noticeable enhancements to your system's performance and reliability.
Use Case Scenario Analysis: Zipkin
Distributed surveillance tools present developers with a wealth of valuable insights. Zipkin stood the test of time, demonstrating remarkable adaptability across diverse situations and establishing its stride in this competitive landscape. The following narrative will delve deep into the versatile efficacy of Zipkin.
Perspective 1: Navigating through the Maze of Microservices Architecture
Interdependent microservices form a tangled web that often complicates the process of isolating the origin of network requests. This is where Zipkin steps in, serving as a proficient tool for tracking requests across a myriad of services.
Imagine a versatile online shopping platform with segregated sections, each dealing with user interactions, product display, wishlists, and financial transactions. When a customer initiates a purchase, the service request circulates through these distinct sections. Identifying malfunctioning elements without traceability would be akin to spotting a tiny pebble on a vast mountain range.
Here, Zipkin comes into its own by allocating a distinct identification number for each service interaction; effectively tracking the path of requests throughout the entire system. This empowers the technology team to isolate areas in need of tweaking, ultimately enhancing customer experience.
Perspective 2: Amplifying Efficiency Metrics
One of the cardinal advantages of Zipkin is its ability to optimize performance. It presents a graphical depiction of request pathways and records their progress through each service. This enables developers to zero in on elements causing delays.
Consider the scenario of a digital multimedia platform plagued by sluggish loading times. With Zipkin, the technical squad can plot the request's trail from the user's device all the way to backend operations encompassing content distribution, user authentication, and media encoding. Having this data at their fingertips aids them in deducing whether a certain service, network lag, or the user's device is the culprit, ultimately expediting service delivery.
Perspective 3: Uncovering Anomalies and Streamlining Bug Extermination
In addition, Zipkin aids in identifying hiccups and accelerates the debugging process. In the face of technical glitches, developers can utilize tracked data to generate a timeline or establish a connection to the error. This correlation can shed light on the crux of the problem.
Picture customers struggling with a purchase on an online shopping platform. While error reports imply a hiccup in payment processing, the actual root cause remains elusive. By implementing Zipkin, the technical team can trace the requests and discover that the hiccup isn't emanating from the transaction module, but an interruption in connecting the customer's saved items with the payment gateway. Armed with this insight, they can promptly address and rectify the issue, reducing disruptions and elevating customer satisfaction.
To sum it up, the role of Zipkin in tracing sprawling setups, especially in microservices-oriented architecture is immeasurable. It enhances efficiency as well as aids in highlighting and rectifying operational inadequacies. These benefits can be tied to Zipkin's user-friendly and intuitive design, which explains its soaring popularity among programmers dealing with intricate distributed networks.
Performance Metrics: Jaeger vs Zipkin
Let's delve into an analytical comparison of two leading distributed tracing techniques, Jaeger developed by Uber and Zipkin established by Twitter, focusing on their operational attributes.
Evaluating Jaeger's Performance Characteristics
Uber's Jaeger is acclaimed for its exceptional capacity and scalability. This tool demonstrates its effectiveness for applications operating over extensive scope as it swiftly navigates through large quantities of data.
- Trace Retention Capacities: A cutting-edge trace shrinking and storing process that Jaeger employs cooks up an impressive capability to log numerous traces per second while maintaining optimal performance.
- Data Analysis Time: With its sophisticated data sorting and probing algorithms, Jaeger manages to keep lag-time minimal despite dealing with large data compilations.
- System Requirements: After considering system essentials, Jaeger stands out thanks to its ability to operate optimally with few resources, even when juggling extensive trace data.
- Scalability: Owing to Jaeger's distributed architecture and adoption of growth-adaptable storage solutions such as Elasticsearch and Cassandra, it can handle increasing loads by broadening its scope horizontally.
Reflecting on Zipkin's Performance Characteristics
In contrast, Twitter's Zipkin, appreciated for its straightforward light design, speaks favourably to small to medium-tier applications, for its simplicity of operation.
- Trace Retention Capacities: Even though Zipkin successfully retains traces per second, its potential slightly falls behind Jaeger when strapped with dense data clusters.
- Data Analysis Time: Zipkin experiences a tad more time delay during data scrutiny than Jaeger, largely due to its more rudimentary data sorting and probing methods.
- System Requirements: Being less bulky in design, Zipkin makes do with reduced hardware requirements, but this might escalate when overloaded with data.
- Scalability: While Zipkin's scalability adapts to growth, it might not match the elasticity of Jaeger due to its more basic structure and usage of less expansion-friendly storage mechanisms, like MySQL and SQLite.
Comparative Analysis
When putting Jaeger and Zipkin side by side, both show individual merits and areas needing enhancements. Jaeger's advanced trace-data managing capacity and rapid processing speed cater to applications with a wider reach. Simultaneously, Zipkin's user-friendliness and minimalistic build serve smaller applications well where resource efficiency is a priority.
Notably, this comparison might be subject to change depending upon individual usage situations, system setups, and the condition of the accessible hardware and network setup. As a result, a detailed performance audit is recommended before finalizing whether Jaeger or Zipkin better fulfills your distributed tracing requirements.
Troubleshooting with Jaeger and Zipkin
Troubleshooting plays a pivotal role in managing any systems, and this is true for distributed tracing systems such as Jaeger and Zipkin. Each of these platforms equips users with distinctive tools and strategies conducive for swift and effective issue resolution.
Problem-solving with Jaeger
When it comes to tackling issues, Jaeger banks heavily on its potent tracing functionalities. It empowers users by allowing them to track individual requests as they maneuver through a multitude of services, thus facilitating problem localization.
A critical part of Jaeger's problem-solving toolkit is the Trace View functionality. Offering an in-depth perspective of a trace, this function presents a chronology denoting the start and conclusion of each span and their interrelatedness. This proves beneficial when trying to spot system lags and congestion points.
Additionally, Jaeger's Trace Graph contributes significantly to issue resolution. Through its graphic depiction of the trace highlighting the interconnectedness of different services and operations, users can discern disharmonies and patterns signifying potential issues.
Moreover, Jaeger offers diverse filtering options, such as service, operation, and tag filters. Users can access these in numerous combinations to zero in on specific problems.
Problem-solving with Zipkin
Zipkin’s problem-solving philosophy is hinged on user-friendliness and simplicity. Similar to Jaeger, it presents a trace view manifesting a request's journey through the system, albeit, with less contextual specifics and more focus on essential details.
One tool that sets Zipkin apart for tackling issues is its Dependency Graph. This tool visually outlines the interplay between different services, illustrating the volume of traces traversing through each service and the locations of error occurrences. This proves useful in spotting problematic services or operations.
Furthermore, Zipkin offers a range of filters such as service, span, and annotation filters. These can be used alone or in varying combinations to pinpoint problem origins.
When compared head-to-head, both Jaeger and Zipkin offer adept problem-solving capabilities, differing slightly in their methodologies. Jaeger tends to deliver in-depth insights and intricate visualizations catering to complex problem analysis. Conversely, Zipkin streamlines the user experience emphasizing simplicity and ease.
In sum, both Jaeger and Zipkin furnish users with formidable toolkits for managing distributed systems. The optimal platform ultimately hinges on the distinct requirements and predilections of the users.
User Community: Jaeger vs Zipkin
In the arena of systems that enable the tracking of transactions over various distributed systems, it's the software's end users who significantly drive the development and advancement of these tools. This pivotal role of users is evident in two primary tracing systems: Jaeger and Zipkin. We will delve into the intricacies of the user communities behind these two systems, unfolding the characteristics, dynamics, and contributions of each.
Understanding Jaeger's User Base
Jaeger, a project that operates under the auspices of the Cloud Native Computing Foundation (CNCF), is spearheaded by an active and vibrant community of users. The blend of seasoned developers, regular users, and committed enthusiasts within this community aid in shaping Jaeger's journey. Their contributions stretch from engaging in critical discussions, identifying and reporting technical glitches, enhancing programming scripts, to honing user guidelines.
Community interactions within Jaeger primarily take place on GitHub and the allotted CNCF channels on Slack. GitHub serves as the nexus for modifications to the source code and reports on software flaws, whereas Slack discussions offer a platform for users to voice their queries, recount their experiences with Jaeger, and recommend feasible amendments to the system.
Jaeger endorses regular virtual meet-ups within the community, allowing users to directly interact with the primary developers. These virtual platforms are insightful, providing users with a chance to stay abreast with the latest Jaeger updates, address concerns, and get acquainted with new features.
Delving into Zipkin's User Context
Zipkin’s user base, albeit modest compared to Jaeger, is steeped in enthusiasm and commitment. These users actively engage on GitHub and Gitter. Similar to Jaeger, GitHub functions as a platform for sharing alterations made to the source code and outlining software glitches, while Gitter provides a space for users to express their queries and share their encounters with Zipkin.
Not one to lag behind in software progression, the Zipkin community is equally committed to the system's development. They consistently contribute by modifying source codes, reporting software glitches, and enhancing document usability. Additionally, they arrange recurrent virtual meet-ups and online informational sessions to keep users updated on Zipkin's advancement and maintain a direct connection with the primary developers.
Assessing the User Communities
Comparatively, Jaeger and Zipkin enjoy the backing of robust user networks. However, their size and degree of involvement present some differences. Jaeger’s association with the CNCF ensures a broader user network, which is evident from the number of contributions and 'star' ratings on their GitHub page. Currently, Jaeger's GitHub page displays more than 300 contributors and boasts over 10,000 'star' ratings.
On the other hand, although Zipkin may not match up to Jaeger’s numbers, it leads in terms of user engagement. The Zipkin community is acknowledged for its prolific code contributions, active problem-solving, and meaningful discussions. Currently, Zipkin's GitHub page has over 200 code contributors and has notched up 4,000 'star' ratings.
In conclusion, both Jaeger and Zipkin have a reason to rejoice, thanks to their energetic and contributing user groups. Jaeger may have a larger network, but Zipkin's user base exhibits greater involvement and proactivity towards projects. Regardless of the variances in size, these communities are a testament to the widespread application and effectiveness of Jaeger and Zipkin in the realm of distributed transaction tracking systems.
Future Directions: Jaeger vs Zipkin
Delving into the evolving scopes of Jaeger and Zipkin, we acknowledge that these distributed tracing mechanisms grow and morph in alignment with the software industry's fluctuating demands.
Jaeger and OpenTelemetry: An Inevitable Confluence
Jaeger's impending path is intimately woven with the OpenTelemetry initiative, a harmonious blend of OpenTracing (Jaeger being an integral component) and OpenCensus, an alternative open-source tracing instrument. The core mission of this unified front is to lay the groundwork for a comprehensive, consolidated foundation for observability, enmeshing tracing, metrics, and logs.
In its infancy, the OpenTelemetry venture reveals Jaeger's decisive part in its formation. Zealous about this potent integration, Jaeger's developers have begun interlinking OpenTelemetry into its ecosystem, visualizing a future enriched by this fusion.
Switching gears, Jaeger also plans to elevate its user interface while broadening its storage backends. By infusing support for a wider range of databases, Jaeger will demonstrate versatile utility across diverse scenarios.
Zipkin: Decoding Observability
Steering towards effortless navigation, Zipkin harbours ambitions to render its complex systems more approachable to developers. Consequently, this includes augmenting the user interface, broadening the accessibility of documented guidelines, and ensuring a wider availability of explanatory samples and tutorials.
In a bid to increase versatility, Zipkin foresees extending its compatibility with multiple programming languages and frameworks, thus catering to broader applications.
Targeting superior functionality, Zipkin devotes itself to enhance its performance metrics. Undertaking the mission to optimize Zipkin for agility and yield, the team hopes to make it an ideal choice for applications managing high volumes of traffic.
Comparative Panorama: Jaeger and Zipkin
Upon reflection, Jaeger's growing resonance with OpenTelemetry positions it as a pivotal influencer in the observability realm. Simultaneously, Zipkin's commitment to simplicity and productivity renders it an appealing choice for developers. As they continue their evolution, both tools are poised to remain significant contributors in the dynamic world of software development.
Making the Right Choice: Jaeger or Zipkin
Jaeger and Zipkin shine as distinct solutions for decentralized tracking systems. Deciding on the apt tool between these two can be a daunting task. This post offers a detailed comparison of their distinctive traits, designed to assist you in picking the tool that seamlessly matches your requisites.
Identifying Your Specific Demands
Prior to settling on either Jaeger or Zipkin, understanding your specific demands is crucial. Consider the following points during this decision-making process:
- How extensive is your application?
- What type of data are you seeking to trace?
- What programming language are you taking advantage of?
- Do you favor any specific data storage?
- How much budget do you have allocated for the tracing infrastructure?
Having a clear understanding of these points will guide you appropriately in choosing between Jaeger and Zipkin.
Dealing with Magnitude
For monitoring vast applications, Jaeger often excels, thanks to its ability to handle substantial amounts of data; it’s the preferred one for applications of broader scope. Conversely, Zipkin might struggle when deployed on larger projects.
Tracing Data
Jaeger excels at tracing intricate data with features such as process and tag-oriented filtering. Conversely, while Zipkin also examines data efficiently, it’s better suited for uncomplicated tracing activities.
Coding Language Compatibility
Both Jaeger and Zipkin offer compatibility for multiple coding languages. Nonetheless, verify each tool's suitability with less frequently used languages.
Choices for Data Storage
Jaeger provides more versatility, facilitating a variety of platforms–Elasticsearch, Cassandra, and Google Cloud Storage. In contrast, Zipkin principally offers support to Elasticsearch and Cassandra.
Financing
Although Jaeger and Zipkin are freely accessible being open-source, their operational costs can differ subject to your specific application. Sudden expansion could call for a more cost-effective alternative, making Jaeger preferable due to superior scalability.
Here's a succinct comparison:
In conclusion, whether Jaeger or Zipkin is more suited to you depends on your unique demands. Understanding each tool's pros and cons is vital to realizing the effectiveness of your choice. Consider your application's extent, your data tracing complexity, chosen programming language, storage preferences, and budget considerations to decide the ideal tool for you.
Conclusion: A Final Verdict on Jaeger vs Zipkin
In the world of systematic architectures that track and supervise data interactions, Jaeger and Zipkin indeed stand their grown. Each system has peculiar advantages and limitations. The preference for one over the other primarily hinges on the specific prerequisites of the project.
Jaeger: Taking Leads with Comprehensive Features
Jaeger is a formidable contender in the arena of systematic tracing due to its expansive feature set and malleable architecture. It provides dynamic capabilities, like precision timestamping and intricate span correlation, making it extraordinarily effective in detecting and sorting out efficiency breakdowns in intricate data systems.
Being an open-source software, Jaeger also enjoys enthusiastic backing from a devoted group of developers. Jaeger's harmonized functioning with other monitoring tools, like Prometheus and Grafana, as well as its accommodation for various data store backends, lands it as a universally suitable option for a variety of scenarios.
However, the deep unfathomable features and complex built of Jaeger pose a challenge. It entails an intense learning process and demands substantial resources for creation and sustenance, which could pose a hurdle for smaller teams.
Zipkin: Prioritizing Simplicity and Promptness
In contrast, Zipkin outshines with its simplistic design and promptness. For those seeking streamlined tracing system, Zipkin's modest, straightforward functionality is matchless. It's a go-to tool for those wanting an uncomplicated, swiftly-implementable solution.
Zipkin's minimalistic approach doesn't compromise on utility, as it offers quintessential tracing attributes such as latency assessment and dependency mapping. Administration of Zipkin is user-friendly due to its adaptability to numerous languages and protocols as well as an intuitive user interface.
However, Zipkin's blatant simplicity means it misses out on the progressive features that Jaeger has to its credit, including adaptive sampling and intricate correlation of spans. Moreover, it lags behind Jaeger when it comes to support for storage backends.
Jaeger vs Zipkin: A Comparative Summary
Inference
Summarizing, both Jaeger and Zipkin have their one-of-a-kind merits that make them effective choices for systematic tracing. The decision to opt one over the other should be largely dependent on the specific project essentials and available resource bandwidth.
If the project demands a multi-faceted, resource-intense solution with a broad range of features, Jaeger stands out. However, if you are looking for a simpler, user-friendly tool that offers speedy and efficient solutions, Zipkin would be more suitable.
The objective should never be to choose the 'superior' tool but to select the optimal tool that commensurates with your specific project needs. Jaeger and Zipkin have both exhibited their proficiency in systematic tracing and can be an impressive extension to your data supervision toolkit.
FAQ
Subscribe for the latest news


.jpeg)